Interactive visuals make a lot of text unnecessary
This page shows a information from the existing iReport 'PlanMER Luchtvaartnota. The information serves the purpose of demonstrating the use of interactivity in visuals in an iReport.
Interactive visuals make information understandable
Interactive visuals offer the possibility to explain the visual, but also to replace texts with visual information, whereby (parts of) texts can be layered under the visual. In addition to placing text under the visual, it is also possible to link videos or links to the visual.
Below is an example of an interactive visual from the iReport 'PlanMER Luchtvaartnota'. It is also shown how the same information could be visualised in the PDF.
Example of an interactive visual with layered information in text
Here is an example of an interactive visual with layered information in text. Below the interactive visual a screenshot is shown how this is presented in the pdf of the document.
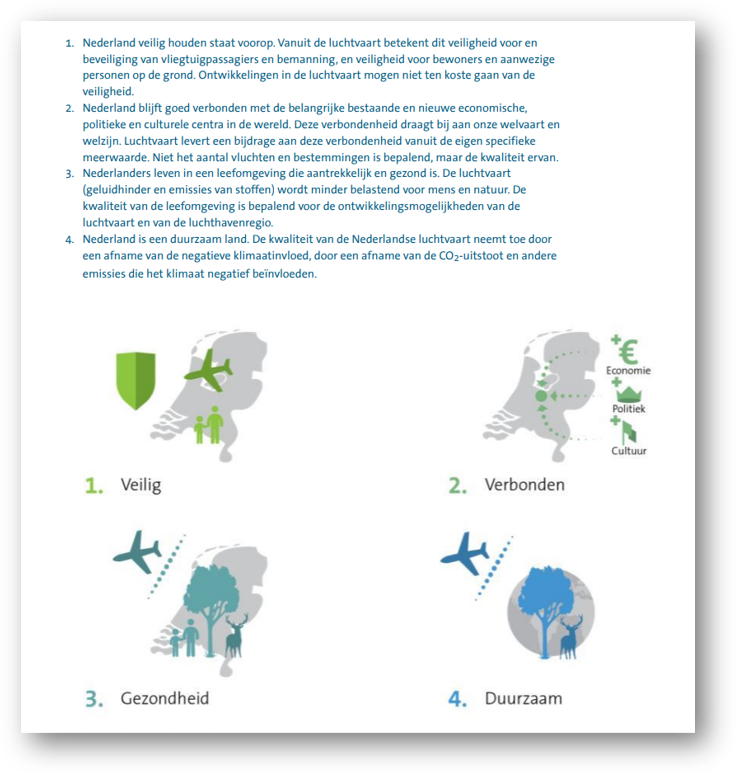
Four themes in aviation planning
When creating the iReport, it is easy to indicate per channel (desktop or laptop, tablet, mobile phone or PDF) which information, and how this should be displayed.
In the PDF, the information from the example above is presented as follows: